Here is my maths page!!!
Limeade challenge
Limeade challenge is where we split up into about five groups. We were given a recipe for 2 people and asked to calculate the amounts needed for five people.
That was the hardest challenge I did in maths but I enjoyed tasting the sweet delicious limeade at the end. ( We actually drank some of the limeade before the teachers tested it, don't tell them!)
That was the hardest challenge I did in maths but I enjoyed tasting the sweet delicious limeade at the end. ( We actually drank some of the limeade before the teachers tested it, don't tell them!)


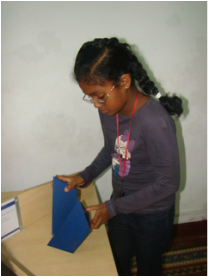
Field trip! : I tried out this strange activity where you had to fit these irregular shapes to make one strange shape. Hard right? At the end, I found that you just need to twist and turn the shape to find it's right fitting. Well, at first I thought that the creator of this game had made a mistake but then I learnt that the game wasn't straightforward: you need to get inside the mystery and think out of the box. Any way, I loved this field trip!!!
Here is one of my summative assessments!!!
Introduction
MY math inquiry was about Cyber Bullying. Cyber Bullying is when kids bully each other through electronic technology, such as through Twitter, Facebook, Email and Snap chat. Cyberbullying messages and images can be posted anonymously and distributed quickly to a very wide audience.
STEP 1 – IDENTIFY THE PROBLEM
Children of all ages getting Cyber bullied through various Medias.
HYPOTHESIS, SAMPLE SELECTION AND TESTING THE
HYPOTHESIS
Step 2: Pose a research question (What you hope to learn from asking the question).
In the survey, in the survey the questions I asked were …
Have you ever been cyber bullied?
If yes, on what software Email, Facebook. Twitter, Snap chat and other Websites.
Step 3: Hypothesize the expected outcome of the research.
· My hypothesis is that the majority of the OSC students from Grades 3 to 12 had been cyber bullied. I thought that boys would get more cyber bullied than girls because they use more technology.
Step 4: Develop a plan for how to test the hypothesis (Experiment, Survey, and Observation)
Population – OSC Students
Sample – Grade 3 to Grade 12
Random Sample – 5 Students from each grade
Step 5: Conduct the plan.
I wanted to test my hypothesis and so I visited every class and randomly picked five students from each grade. Some students were a little bit unsure about the meaning of cyber bullying and the others were eager to talk.
RESULTS/DATA
GRADE : 3 4 5 8 10 12
EMAIL : 0 : 1 : 0 : 0 : 1 : 0
TWITTER : 0 :0 : 0 :0 : 0 : 0
SNAPCHAT : 0 : 0 : 0 :0 :0 : 0
FACEBOOK : 0 : 1 : 1 : 0 : 1 : 2
OTHER : 0 : 6 : 1 : 0 :1 : 1
(websites)
Step 6: Organize the data (tables & graphs)
( when I tried to copy all the data it refused to come on to the page, so I am very sorry)
Step 7: Analyse the data (mean, median, and mode. Answer the research question based on the data.)
MEDIAN – 0 0 2 4 9= 2 MEAN – 0+0+2+4+9=15÷5=3
MODE –0 0 2 4 9= 0
RANGE –0+9= 9
ANALYSIS
This survey doesn’t prove my hypothesis as only 40%, of the students were Cyberbullied. It is important to note that all the students of grade 4 had been cyber bullied and no students in Grades 3 and 8 had been bullied. This made the maximum range which is 5. Out of twelve students who had been cyber bullied five students are in grade 4 which is nearly 40%.Snap chat and Twitter were not used as software. Surprisingly other software have been used to cyber bully people. It is important to investigate on this software because we can then inform and educate students, teachers and parents, about the negative side of these websites. The email had been used least frequently for cyber bullying The Grade 3 children had not been cyber bullied and this maybe due to unawareness of Cyber bullying as they are quite young. This data will be very useful for Grade 4 teachers and parents but also students because this can discourage children who might get the idea to bully at this stage. Possibly by the end of Year 3, students can be instructed to inform the parents or teachers if there is any kind of Cyber bulling. This will prevent it from getting worse or spreading.
REFLECTION
The draw backs were that the Secondary students didn’t reply to my emails and also that fact that they had to go for Week without Walls, as we started the survey. I learnt that I should never rely on email feedback only. I needed to do personal visits to get my survey questions answered. I appreciated the students for sharing with me the fact that they were bullied. It may not have been easy however they helped me to complete my survey and to make it success. There were a few drawbacks I had to face. When my partner and I emailed a survey to the Secondary students, none of them replied. I was not able to interview any Grade 6s and 7s because I could not find them during Secondary break time. Most of the Secondary section then left for Week Without Walls, so we had to change our sample survey to only include Grades 3, 4, 5, 8, 10 and 12.From this very important lesson I learnt that you should never only rely on email to get results because some students do not check their emails daily or even if some do they do not perhaps have the time to fill out surveys.
OBSERVATION
Note: In grade 4 all the five students in the sample had been bullied. However three people had been bullied more than once and in calculating the amounts I have taken only the number of students who had been bullied. I thought that you just had to go to each Grade and randomly pick five people but some people in Primary didn’t even know what Cyber bullying was. Perhaps that is why nobody in Grade 3 admitted that they had got Cyber bullied. Some children may have never been cyber bullied in grade 3 or they might have been too shy to admit that. I wanted to test my hypothesis and so I visited every class and randomly picked five students from each grade. Some students were a little bit unsure about the meaning of cyber bullying and the others were eager to talk. There were a few drawbacks I had to face. When my partner and I emailed a survey to the Secondary students, none of them replied. I was not able to interview any Grade 6s and 7s because I could not find them during Secondary break time. Most of the Secondary section then left for Week without Walls, so we had to change our sample survey to only include Grades 3, 4, 5, 8, 10 and 12. From this very important lesson I learnt that you should never only rely on email to get results because some students do not check their emails daily or even if some do they do not perhaps have the time to fill out surveys.

